Dashboard preview for Aiven for Grafana®
Grafana's dashboard previews provide a visual overview of your dashboards, displaying each configured dashboard as a graphical thumbnail.
Dashboard previews are an optional beta feature available in Grafana 9.0+. By default, this feature is disabled on Aiven for Grafana® services.
Enable dashboard previews
-
In the Aiven Console, select your project and choose your Aiven for Grafana® service.
-
Click Service settings in the sidebar.
-
Scroll down to Advanced configuration and click Configure.
-
In the Advanced configuration window, click Add configuration options.
-
Find and set
dashboard_previews_enabledto Enabled. -
Click Save configuration. The status next to
dashboard_previews_enabledchanges tosynced. -
Click Overview. From the Connection information, copy the Service URI into your browser to open the Grafana login page.
-
Enter the username and password from the Connection information, and click Log in.
-
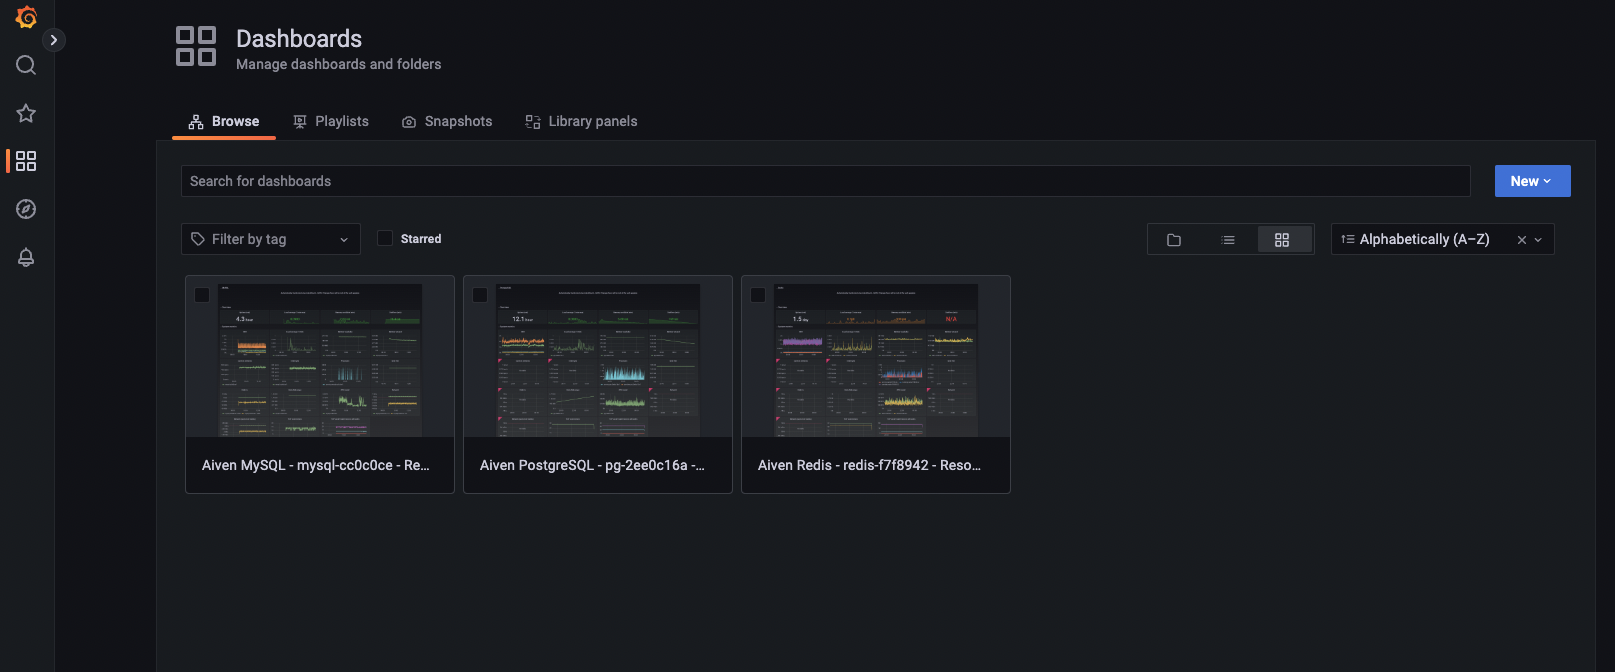
Click Dashboards in the left menu, and select the grid layout to view dashboard previews. Previews are displayed as thumbnails and can be sorted alphabetically.
Limitations
- Dashboard previews are not available for Hobbyist and Startup-1 plans.
- Before downgrading your service plan to Hobbyist or Startup-1, first disable dashboard previews.
Related pages
For more information on Dashboard previews, see Grafana documentation.